UPS Monitoring
First off, you have connected the UPS to a free USB port and it shows up using lsusb thus:
| |
Install the required APC UPS daemon and PHP packages with:
apt install apcupsd php -y
Once installed stop the apcupsd service if it started automatically with
systemctl stop apcupsd
You’ll next need to edit the configuration file for the service which lives at /etc/apcupsd/apcupsd.conf . If you’d like enter a UPSNAME that makes sense. Then the default version of this file on my system had a line that looked like DEVICE /tty/xxx0, comment out or delete this line and restart the service with:
| |
If everything looks good in status you should now be able to run:
| |
You’ve completed the UPS / host setup.
InfluxDB Setup
| |
I’ll put all the data from your UPS into a separate database.
First, we’ll need to create it and can do so using curl:
| |
We can verify successful DB creation again using curl:
| |
| |
Note that final entry is ups which is the database we just created. Now we have to move onto scraping the output the UPS generates and write it to the database.
Scraping the UPS output
Note the section near the top tagsArray and compare the items in the array being scraped against the actual output of apcacess as shown above. Pick and choose the items you want and these are what will be written to the database. The name must match exactly else the scraping will fail.
You will also need to modify, near the bottom, your InfluxDB IP. You needed this above for the curl commands.
| |
| |
You can do a test run with /opt/scrape.php and then verify your InfluxDB logs and look for some successful writes via curl (code 204 = good).
Automating the scraping
We’ll use cron for automating the running of the scraping script. Do not edit the crontab with crontab -e instead you must edit /etc/crontab and specify a user in order for this work.
Add the following line to /etc/crontab, this will run the scraping script every minute.
| |
Again verify the InfluxDB logs for 204 response codes to check everything went OK.
Grafana Dashboard
The next step is to add a data source in Grafana. Under the configuration menu in Grafana click “Add data source”.
Modify the Name, Type = InfluxDB, URL = http://influxdb:8086, Database = ups, User = root, Pass = root . If you modified these values obviously modify to suit.
Then hit save & test.
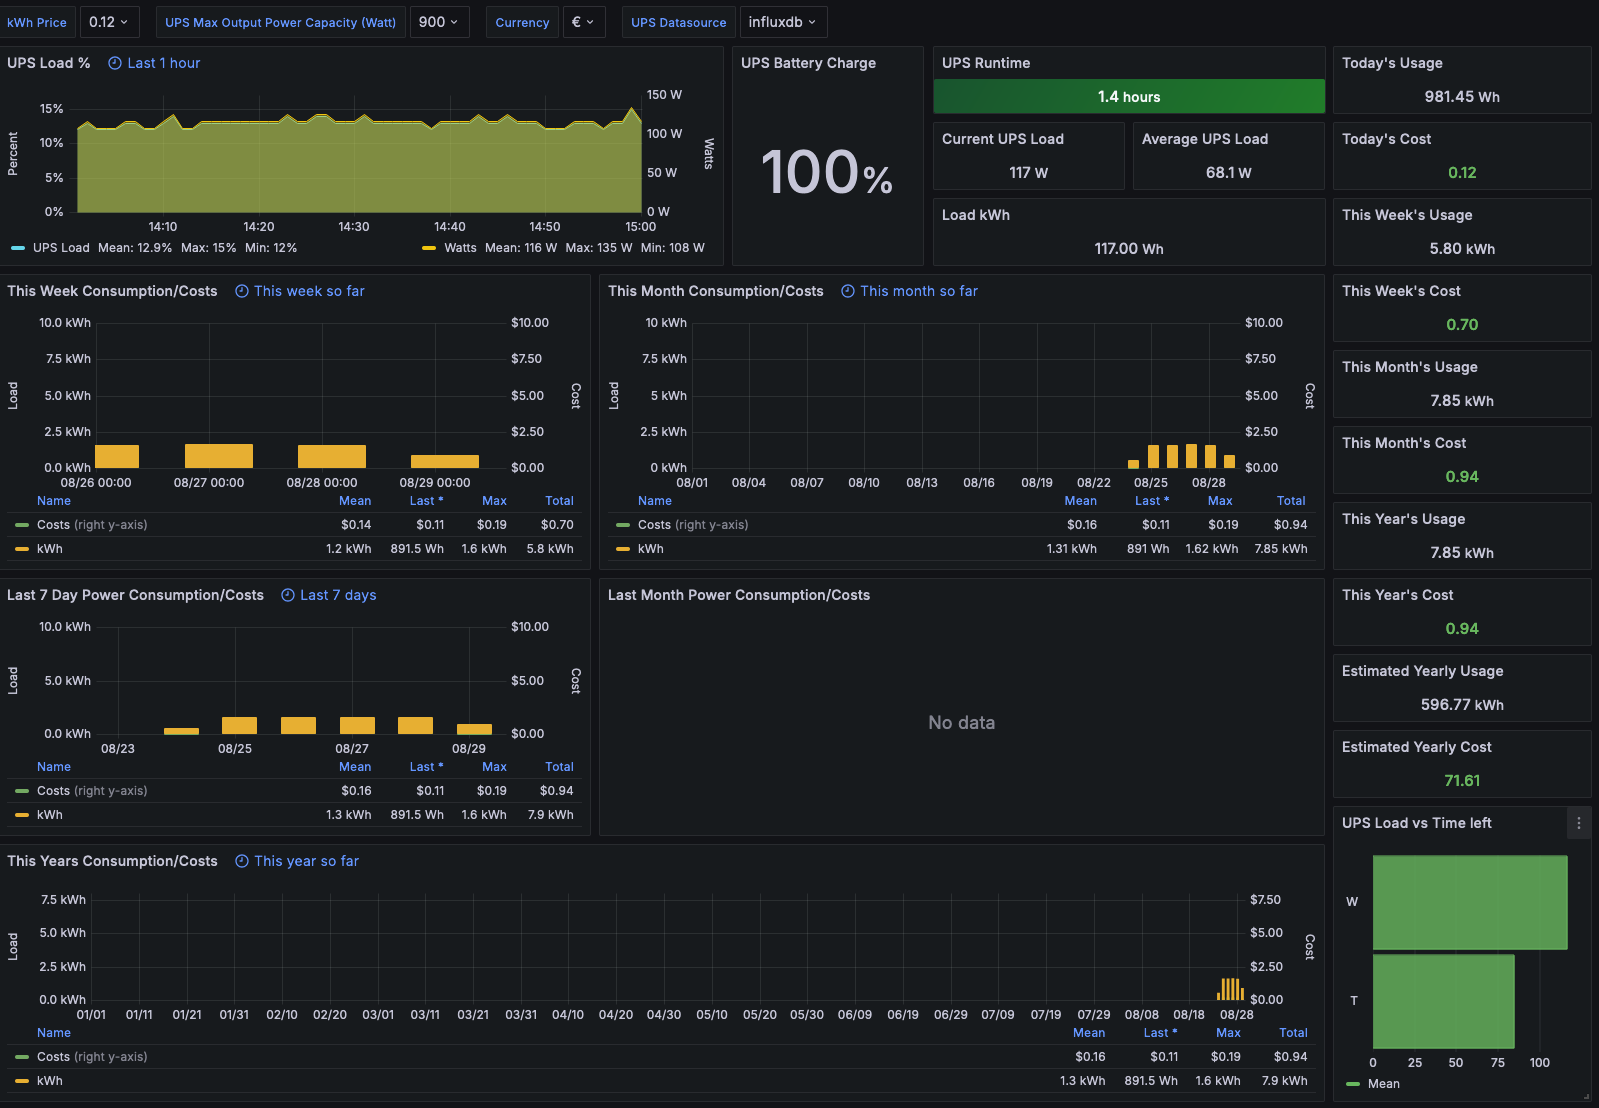
Next in Grafana click the + icon on the left and select ‘import’. We’ll be importing this awesome dashboardby Marius Gilberg. The ID you need is 7197.
Select your Influx UPS data source as the new data source we just created above and hit import.
